Understanding your patients and the environment around them is vital to the success of a practice or healthcare organization. Data and statistics are the building blocks for making prudent choices for your institution. Having software that can effortlessly gather that information is valuable for maintaining proper patient care and creating service offerings to best serve your communities. A low-cost place to start is by evaluating the kinds of symptoms that your organization handles from patient phone calls.
Nurse triage software such as MyTriageChecklist allows nurses to use guided protocols to evaluate patient symptoms when they call and has detailed reporting capabilities. The software provides a wide array of reporting to help medical organizations and institutions pinpoint information such as the main reasons for call, the amount of call volume during specific times, and any clusters around phone calls and symptoms. Here’s how it works and how it can help.
Function
Once a nurse takes a patient phone call, the MyTriageChecklist software Call Center Version stores the data in a HIPAA-compliant server. The data can then be used to create reports. Examples include number of phone calls, and the percentage of each disposition given. The Call Center Version of the software even allows managers to evaluate the entire nurse system. This includes call back times and number of calls taken per hour.
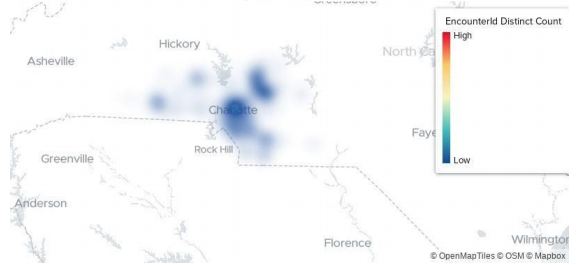
One interesting report is the geo-mapping and heat map report. The nurse triage software is linked with data analysis software and has the ability to build geographical heat maps based on US zip codes. Using these zip codes and the protocols used during a nurse triage call, we have the ability to track trends by geographical location.
The analytics dashboards and reports all offer the ability to filter by any criteria that is captured in the data. This includes time periods, users, protocols, and dispositions. These data points can all be examined to determine trends or deep dive different areas of care as needed.
Uses
In addition to simple filtering, analytics users can drill down further to find even more specific data points, opening up many possibilities. Many marketing mailers are priced per zip code. Targeted marketing to specific zip codes (using an image of a heat map, showing cases in their area) can be used to give a visual aid to patients and reinforce the importance of getting a yearly flu shot. The heat maps allow you to look for specific symptoms in a particular area, and use the information to evaluate population education and intervention to assist a certain geographical location based on issues presented. In addition, year to year comparisons can be used to clarify additional needs and trends.
Flu Season Example (using data from a large Medical Group based in North Carolina)
In addition to the reports, MyTriageChecklist allows nurses to send handouts and customize doctor orders based on doctor preferences. You can export your reporting in a .JPEG or CSV file format for further analysis and comparison with your other health data.
Reporting features such as geo-mapping and heat maps can allow you to understand your patient base and the environment in which your practice is operating. With the right software, you can narrow your efforts to communities that need it the most.
Email TriageLogic at info@triagelogic.com to get details about how our reporting features can work for your practice or organization.